.png)


Thank you! Your submission has been received!
Oops! Something went wrong while submitting the form.


How often have you encountered a tool or platform that claims to unleash business potential, only to find out it’s more of a trendy phrase than a true innovation? If you’ve ever felt this way, you’re not alone.
Unlike those fleeting promises, business insights with Power BI are a real, tangible solution that helps organizations leverage their data effectively. In this blog, we’ll explore how Power BI empowers businesses to transform raw data into meaningful, real-time insights that drive smarter decisions, optimize operations, and provide a clear competitive advantage.
Power BI is a Microsoft business analytics suite designed to help organizations turn raw data into actionable insights. It simplifies data visualization, enables the sharing of critical insights, and aids in decision-making processes. Power BI connects seamlessly with a range of data sources, from simple Excel sheets to complex cloud-based services, making it adaptable to various business needs. One of its key capabilities is the creation of interactive reports and dashboards, which allow users to visualize their data in real time.
Now that we’ve defined what Power BI is and how it empowers organizations, let’s explore the key features that make it a powerful tool for generating actionable insights instead.

As businesses increasingly rely on data to make smarter decisions, having the right tools to extract meaningful insights becomes crucial. Power BI is designed to empower teams to do just that. Let’s break down its core features and how they help businesses generate valuable insights.
Power BI offers robust integration capabilities. It easily connects to various data sources, such as SQL Server, Azure, and Excel. This broad compatibility ensures that businesses of all sizes can use the data they already have, no matter where it’s stored.
One of the standout features of Power BI is Power Query. It allows users to clean, transform, and model data with ease. This transformation process ensures that raw, unstructured data becomes usable, meaningful, and ready for analysis.
Power BI’s visualizations bring data to life. Dynamic visuals like bar charts, heat maps, and trend lines allow businesses to identify patterns and trends quickly. For example, a retailer might use heat maps to visualize store performance across different regions, making it easier to spot areas that need attention.
Power BI lets users create personalized dashboards tailored to specific business needs. These dashboards track KPIs and performance metrics, offering decision-makers clear views of their most important data points. It empowers teams to track progress in real time, adjusting strategies as needed.
Power BI integrates machine learning and natural language processing (NLP) to deliver AI-driven insights. These advanced capabilities help businesses predict future trends and make decisions based on data-driven forecasts. For example, a financial services firm might use these AI features to predict market trends or identify emerging investment opportunities.
With these core features, Power BI business insights enable organizations to leverage their data more efficiently and impactfully.
In the next section, we will dive deeper into how Power BI’s data transformation and visualization capabilities streamline the process of generating actionable insights.
Data transformation and visualization are key processes in converting raw data into actionable business insights. With Power BI, organizations can simplify these processes, ensuring that data is well-prepared, analyzed effectively, and presented in a way that drives informed decision-making.
Power BI leverages the ETL (Extract, Transform, Load) framework to prepare data for analysis. The Extract phase gathers data from various sources such as databases, cloud services, or local files. During the transform phase, Power BI cleanses the data by removing inconsistencies, handling missing values, and ensuring uniformity across data sources.
This transformation ensures that the data is usable and suitable for deeper analysis. Finally, the load phase integrates the clean data into Power BI’s data model for reporting and visualization. This process makes it possible to work with large volumes of data from multiple sources seamlessly and efficiently.
Once the data is prepared, data modeling organizes and structures it in a way that aligns with business goals. This includes defining relationships between different datasets, creating calculated columns or measures, and aggregating data as needed. Power BI’s analytics capabilities, such as time intelligence and statistical models, enable businesses to detect trends, patterns, and anomalies.
By applying these techniques, Power BI allows organizations to generate precise insights, such as identifying fluctuations in performance metrics or spotting correlations between different data points. This makes it easier to understand underlying business dynamics and identify actionable insights quickly.
Power BI is known for its powerful interactive visualizations, such as bar charts, line graphs, scatter plots, and heat maps. These visualizations help represent data intuitively, making it easier for users to understand and analyze. Advanced visualizations allow decision-makers to interact with the data by clicking on specific data points to drill down for further insights or filtering the data to examine specific subsets.
The real-time interactivity of these visualizations helps users uncover insights on the fly, providing flexibility for immediate decision-making. Furthermore, users can create personalized reports that tailor the visualizations to specific roles or needs, enhancing their ability to monitor key performance indicators (KPIs) and other critical metrics.
After discussing Power BI's key data transformation and visualization features, we will now examine its practical applications in various industries.
Power BI’s capability to transform data into meaningful insights is utilized in various real-world scenarios. This allows companies to make more informed decisions and enhance their strategies.
In sales and marketing, Power BI helps organizations track key performance metrics like conversion rates, lead generation, and customer engagement. By visualizing data from CRM systems, businesses can identify trends and opportunities for improvement. Business insights with Power BI empower marketing teams to adjust campaigns based on real-time data, ensuring higher efficiency in targeting and customer acquisition.
Power BI is widely used in financial analytics for budget management and report creation. It allows finance teams to visualize income statements, balance sheets, and cash flow in real time. This helps in monitoring budget adherence and spotting discrepancies early. Business insights with Power BI help streamline financial processes, enhance forecasting accuracy, and improve decision-making, leading to better financial health and planning.
Supply chain management benefits from Power BI’s ability to provide insights into inventory levels, logistics, and vendor performance. By visualizing supply chain data, businesses can optimize operations, reduce waste, and ensure timely deliveries. Power BI supports organizations in tracking and improving operational efficiency by pinpointing issues in the supply chain and suggesting potential improvements based on data trends.
Human resources departments use Power BI to analyze employee performance, retention rates, and staffing needs. With Power BI, HR teams can create dashboards that track employee productivity and satisfaction. Integrating performance data and business insights with Power BI helps HR professionals make data-driven decisions regarding recruitment, training, and employee development, improving overall workforce management.
In healthcare, Power BI is used to analyze patient data and track hospital performance. From monitoring patient outcomes to managing hospital resources, business insights with Power BI assist healthcare organizations in making decisions that improve patient care and operational efficiency. Healthcare providers can use these insights to optimize staffing, reduce wait times, and enhance patient satisfaction.
Let’s focus on the next important element of Power BI: Collaboration and Sharing.
Effective collaboration is key to turning data into action. With Power BI, the process of sharing and collaborating becomes simple and efficient, ensuring that teams can access critical insights when needed.
Power BI makes sharing reports and dashboards across teams effortless. Whether it’s through the Power BI service or via integration with other platforms, employees can access key insights instantly, improving transparency and collaboration. This streamlined sharing allows businesses to make quicker, more informed decisions based on the latest data.
Power BI’s ability to embed reports into applications like CRM systems, websites, and SharePoint adds another layer of convenience. This allows teams to view essential business insights without disrupting their workflow. Business insights with Power BI become part of daily operations, allowing employees to act on data without leaving the systems they already use.
By making data accessible and shareable, Power BI plays a significant role in shaping a company’s culture around data-driven decision-making. With insights available to everyone, from front-line employees to top executives, the whole organization can become more analytical and proactive in its approach.
With sharing and collaboration in place, businesses need robust security measures to protect sensitive data.
Ensuring security and proper governance are non-negotiable when handling sensitive business data. Power BI provides robust security features that help businesses maintain control over their data while adhering to compliance regulations.
Power BI offers role-based access controls to ensure only authorized personnel can view specific data. Organizations can safeguard sensitive information by designating specific roles to various users, including data analysts, managers, and executives, thereby preventing unauthorized access.
Additionally, data encryption ensures that data remains protected at rest and during transit, offering peace of mind for businesses dealing with critical or confidential information. These layers of security help businesses manage data access with precision, allowing them to easily meet security and compliance requirements.
Effective data governance is critical for managing how data is accessed, used, and shared across an organization. Power BI simplifies data governance by providing tools that enforce secure access policies and track data usage.
Administrators can set up policies that dictate who can access what data and ensure compliance with industry regulations such as GDPR or HIPAA. This capability ensures that sensitive data is handled responsibly while maintaining the integrity and accuracy of reports.
With a clear focus on security and governance, businesses can confidently rely on business insights with Power BI. Now, let’s explore the benefits of using Power BI in more detail.
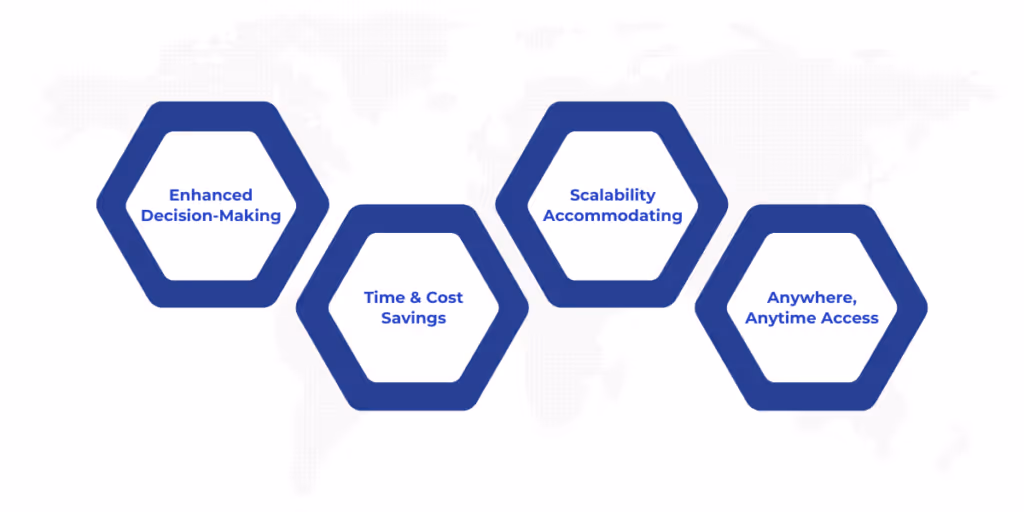
Power BI delivers numerous advantages that help businesses streamline their data processes and make informed decisions. Its benefits go beyond simply offering tools for data visualization; it enhances decision-making, saves resources, and ensures scalability across organizations of all sizes.
With business insights from Power BI, decision-makers can access clear, actionable reports that deeply understand business performance. Power BI allows leaders to make well-informed, data-backed decisions by consolidating data into comprehensive reports. These insights empower CXOs, CMOs, and other decision-makers to adjust strategies based on real-time data, driving improved business outcomes.
Automating data processes is one of the most powerful features of Power BI. Instead of manually compiling and analyzing data, businesses can rely on automated workflows for consistent and accurate reporting. This saves time and reduces the risk of errors. By automating repetitive tasks, companies can focus resources on higher-value activities, such as strategy development and customer engagement.
Whether you’re a small startup or a large enterprise, Power BI scales to meet your organization’s needs. Small businesses can use it for basic data analysis, while larger organizations can implement it for complex, enterprise-wide analytics. The platform's flexible architecture supports the growing data demands of businesses, allowing them to expand their usage as needed without worrying about limitations.
With Power BI’s cloud-based solutions, teams can access business insights from anywhere, anytime. The cloud makes it easy for employees to view reports, interact with dashboards, and collaborate on data-driven decisions, whether in the office, at home, or on the go. This flexibility ensures that decision-makers are always in the loop and can quickly respond to emerging business needs.
Power BI is the bridge between raw data and actionable business decisions. It transforms complex datasets into clear, strategic insights that businesses can act on, immediately driving better sales, refining financial reporting, and optimizing operations. The result? More efficient processes, more informed decisions, and ultimately, a more agile business.
Whether you’re a growing enterprise or a well-established leader, it equips teams with the insights to drive performance at every level. The beauty of Power BI lies not just in its functionality but in its ability to empower individuals, from CXOs to front-line staff, to make decisions based on data, not assumptions.
At WaferWire, we believe in the power of business insights with Power BI to accelerate transformation. With our deep expertise, we don’t just help you implement Power BI—we partner with you to fully leverage its capabilities, ensuring that every decision you make is informed, timely, and impactful.
Transform your data into real business value today. Connect with us and let’s start turning your insights into success.


How often have you encountered a tool or platform that claims to unleash business potential, only to find out it’s more of a trendy phrase than a true innovation? If you’ve ever felt this way, you’re not alone.
Unlike those fleeting promises, business insights with Power BI are a real, tangible solution that helps organizations leverage their data effectively. In this blog, we’ll explore how Power BI empowers businesses to transform raw data into meaningful, real-time insights that drive smarter decisions, optimize operations, and provide a clear competitive advantage.
Power BI is a Microsoft business analytics suite designed to help organizations turn raw data into actionable insights. It simplifies data visualization, enables the sharing of critical insights, and aids in decision-making processes. Power BI connects seamlessly with a range of data sources, from simple Excel sheets to complex cloud-based services, making it adaptable to various business needs. One of its key capabilities is the creation of interactive reports and dashboards, which allow users to visualize their data in real time.
Now that we’ve defined what Power BI is and how it empowers organizations, let’s explore the key features that make it a powerful tool for generating actionable insights instead.
As businesses increasingly rely on data to make smarter decisions, having the right tools to extract meaningful insights becomes crucial. Power BI is designed to empower teams to do just that. Let’s break down its core features and how they help businesses generate valuable insights.
Power BI offers robust integration capabilities. It easily connects to various data sources, such as SQL Server, Azure, and Excel. This broad compatibility ensures that businesses of all sizes can use the data they already have, no matter where it’s stored.
One of the standout features of Power BI is Power Query. It allows users to clean, transform, and model data with ease. This transformation process ensures that raw, unstructured data becomes usable, meaningful, and ready for analysis.
Power BI’s visualizations bring data to life. Dynamic visuals like bar charts, heat maps, and trend lines allow businesses to identify patterns and trends quickly. For example, a retailer might use heat maps to visualize store performance across different regions, making it easier to spot areas that need attention.
Power BI lets users create personalized dashboards tailored to specific business needs. These dashboards track KPIs and performance metrics, offering decision-makers clear views of their most important data points. It empowers teams to track progress in real time, adjusting strategies as needed.
Power BI integrates machine learning and natural language processing (NLP) to deliver AI-driven insights. These advanced capabilities help businesses predict future trends and make decisions based on data-driven forecasts. For example, a financial services firm might use these AI features to predict market trends or identify emerging investment opportunities.
With these core features, Power BI business insights enable organizations to leverage their data more efficiently and impactfully.
In the next section, we will dive deeper into how Power BI’s data transformation and visualization capabilities streamline the process of generating actionable insights.
Data transformation and visualization are key processes in converting raw data into actionable business insights. With Power BI, organizations can simplify these processes, ensuring that data is well-prepared, analyzed effectively, and presented in a way that drives informed decision-making.
Power BI leverages the ETL (Extract, Transform, Load) framework to prepare data for analysis. The Extract phase gathers data from various sources such as databases, cloud services, or local files. During the transform phase, Power BI cleanses the data by removing inconsistencies, handling missing values, and ensuring uniformity across data sources.
This transformation ensures that the data is usable and suitable for deeper analysis. Finally, the load phase integrates the clean data into Power BI’s data model for reporting and visualization. This process makes it possible to work with large volumes of data from multiple sources seamlessly and efficiently.
Once the data is prepared, data modeling organizes and structures it in a way that aligns with business goals. This includes defining relationships between different datasets, creating calculated columns or measures, and aggregating data as needed. Power BI’s analytics capabilities, such as time intelligence and statistical models, enable businesses to detect trends, patterns, and anomalies.
By applying these techniques, Power BI allows organizations to generate precise insights, such as identifying fluctuations in performance metrics or spotting correlations between different data points. This makes it easier to understand underlying business dynamics and identify actionable insights quickly.
Power BI is known for its powerful interactive visualizations, such as bar charts, line graphs, scatter plots, and heat maps. These visualizations help represent data intuitively, making it easier for users to understand and analyze. Advanced visualizations allow decision-makers to interact with the data by clicking on specific data points to drill down for further insights or filtering the data to examine specific subsets.
The real-time interactivity of these visualizations helps users uncover insights on the fly, providing flexibility for immediate decision-making. Furthermore, users can create personalized reports that tailor the visualizations to specific roles or needs, enhancing their ability to monitor key performance indicators (KPIs) and other critical metrics.
After discussing Power BI's key data transformation and visualization features, we will now examine its practical applications in various industries.
Power BI’s capability to transform data into meaningful insights is utilized in various real-world scenarios. This allows companies to make more informed decisions and enhance their strategies.
In sales and marketing, Power BI helps organizations track key performance metrics like conversion rates, lead generation, and customer engagement. By visualizing data from CRM systems, businesses can identify trends and opportunities for improvement. Business insights with Power BI empower marketing teams to adjust campaigns based on real-time data, ensuring higher efficiency in targeting and customer acquisition.
Power BI is widely used in financial analytics for budget management and report creation. It allows finance teams to visualize income statements, balance sheets, and cash flow in real time. This helps in monitoring budget adherence and spotting discrepancies early. Business insights with Power BI help streamline financial processes, enhance forecasting accuracy, and improve decision-making, leading to better financial health and planning.
Supply chain management benefits from Power BI’s ability to provide insights into inventory levels, logistics, and vendor performance. By visualizing supply chain data, businesses can optimize operations, reduce waste, and ensure timely deliveries. Power BI supports organizations in tracking and improving operational efficiency by pinpointing issues in the supply chain and suggesting potential improvements based on data trends.
Human resources departments use Power BI to analyze employee performance, retention rates, and staffing needs. With Power BI, HR teams can create dashboards that track employee productivity and satisfaction. Integrating performance data and business insights with Power BI helps HR professionals make data-driven decisions regarding recruitment, training, and employee development, improving overall workforce management.
In healthcare, Power BI is used to analyze patient data and track hospital performance. From monitoring patient outcomes to managing hospital resources, business insights with Power BI assist healthcare organizations in making decisions that improve patient care and operational efficiency. Healthcare providers can use these insights to optimize staffing, reduce wait times, and enhance patient satisfaction.
Let’s focus on the next important element of Power BI: Collaboration and Sharing.
Effective collaboration is key to turning data into action. With Power BI, the process of sharing and collaborating becomes simple and efficient, ensuring that teams can access critical insights when needed.
Power BI makes sharing reports and dashboards across teams effortless. Whether it’s through the Power BI service or via integration with other platforms, employees can access key insights instantly, improving transparency and collaboration. This streamlined sharing allows businesses to make quicker, more informed decisions based on the latest data.
Power BI’s ability to embed reports into applications like CRM systems, websites, and SharePoint adds another layer of convenience. This allows teams to view essential business insights without disrupting their workflow. Business insights with Power BI become part of daily operations, allowing employees to act on data without leaving the systems they already use.
By making data accessible and shareable, Power BI plays a significant role in shaping a company’s culture around data-driven decision-making. With insights available to everyone, from front-line employees to top executives, the whole organization can become more analytical and proactive in its approach.
With sharing and collaboration in place, businesses need robust security measures to protect sensitive data.
Ensuring security and proper governance are non-negotiable when handling sensitive business data. Power BI provides robust security features that help businesses maintain control over their data while adhering to compliance regulations.
Power BI offers role-based access controls to ensure only authorized personnel can view specific data. Organizations can safeguard sensitive information by designating specific roles to various users, including data analysts, managers, and executives, thereby preventing unauthorized access.
Additionally, data encryption ensures that data remains protected at rest and during transit, offering peace of mind for businesses dealing with critical or confidential information. These layers of security help businesses manage data access with precision, allowing them to easily meet security and compliance requirements.
Effective data governance is critical for managing how data is accessed, used, and shared across an organization. Power BI simplifies data governance by providing tools that enforce secure access policies and track data usage.
Administrators can set up policies that dictate who can access what data and ensure compliance with industry regulations such as GDPR or HIPAA. This capability ensures that sensitive data is handled responsibly while maintaining the integrity and accuracy of reports.
With a clear focus on security and governance, businesses can confidently rely on business insights with Power BI. Now, let’s explore the benefits of using Power BI in more detail.
Power BI delivers numerous advantages that help businesses streamline their data processes and make informed decisions. Its benefits go beyond simply offering tools for data visualization; it enhances decision-making, saves resources, and ensures scalability across organizations of all sizes.
With business insights from Power BI, decision-makers can access clear, actionable reports that deeply understand business performance. Power BI allows leaders to make well-informed, data-backed decisions by consolidating data into comprehensive reports. These insights empower CXOs, CMOs, and other decision-makers to adjust strategies based on real-time data, driving improved business outcomes.
Automating data processes is one of the most powerful features of Power BI. Instead of manually compiling and analyzing data, businesses can rely on automated workflows for consistent and accurate reporting. This saves time and reduces the risk of errors. By automating repetitive tasks, companies can focus resources on higher-value activities, such as strategy development and customer engagement.
Whether you’re a small startup or a large enterprise, Power BI scales to meet your organization’s needs. Small businesses can use it for basic data analysis, while larger organizations can implement it for complex, enterprise-wide analytics. The platform's flexible architecture supports the growing data demands of businesses, allowing them to expand their usage as needed without worrying about limitations.
With Power BI’s cloud-based solutions, teams can access business insights from anywhere, anytime. The cloud makes it easy for employees to view reports, interact with dashboards, and collaborate on data-driven decisions, whether in the office, at home, or on the go. This flexibility ensures that decision-makers are always in the loop and can quickly respond to emerging business needs.
Power BI is the bridge between raw data and actionable business decisions. It transforms complex datasets into clear, strategic insights that businesses can act on, immediately driving better sales, refining financial reporting, and optimizing operations. The result? More efficient processes, more informed decisions, and ultimately, a more agile business.
Whether you’re a growing enterprise or a well-established leader, it equips teams with the insights to drive performance at every level. The beauty of Power BI lies not just in its functionality but in its ability to empower individuals, from CXOs to front-line staff, to make decisions based on data, not assumptions.
At WaferWire, we believe in the power of business insights with Power BI to accelerate transformation. With our deep expertise, we don’t just help you implement Power BI—we partner with you to fully leverage its capabilities, ensuring that every decision you make is informed, timely, and impactful.
Transform your data into real business value today. Connect with us and let’s start turning your insights into success.