.png)


Thank you! Your submission has been received!
Oops! Something went wrong while submitting the form.


Microsoft Dynamics 365 is more than just a suite of business applications. It’s a powerful platform that connects data across finance, operations, sales, and customer engagement. While its core strength lies in managing business processes, its true potential is unlocked through effective reporting.
Dynamics 365 reporting tools enable businesses to track performance, identify trends, and support strategic decisions across departments. From real-time dashboards to detailed financial statements, the right reporting solution helps users turn complex data into clear, actionable insights.
This article provides an overview of the main reporting tools available within Dynamics 365. You will learn how each tool works, when to use it, and how it can support your business goals.
Before diving into individual tools, it’s important to understand why reporting matters in the Dynamics 365 ecosystem and how it supports operational excellence.
Reporting isn’t just a backend function. It’s a strategic asset. Within the Dynamics 365 ecosystem, reporting tools play a critical role in helping businesses gain control over their operations and drive smarter decision-making.
Dynamics 365 connects core business areas like sales, finance, operations, and customer service. Reporting tools bring this data together in one place, giving stakeholders a clear view of performance across the organization.
Whether it's tracking sales Key Performance Indicators (KPIs) or monitoring inventory levels, real-time reports ensure everyone is working from the same source of truth.
Without accurate insights, decisions are based on guesswork. Reporting in Dynamics 365 empowers leaders to move beyond gut instincts by surfacing trends, identifying risks, and forecasting outcomes.
From visual dashboards in Power BI to detailed SSRS reports, users can quickly understand what’s working and what needs attention.
Manually pulling data from multiple systems is time-consuming and error-prone. Dynamics 365 reporting tools automate this process, allowing users to generate up-to-date reports with just a few clicks. This not only saves time but also improves data accuracy and consistency.
For industries with strict regulatory requirements, reporting is essential for maintaining compliance. Dynamics 365 provides structured, auditable reports that help organizations meet standards for financial transparency, tax reporting, and internal controls, reducing risk during audits and inspections.
Now that we’ve covered why reporting is essential, let’s explore the tools Dynamics 365 offers and how each fits different business needs.
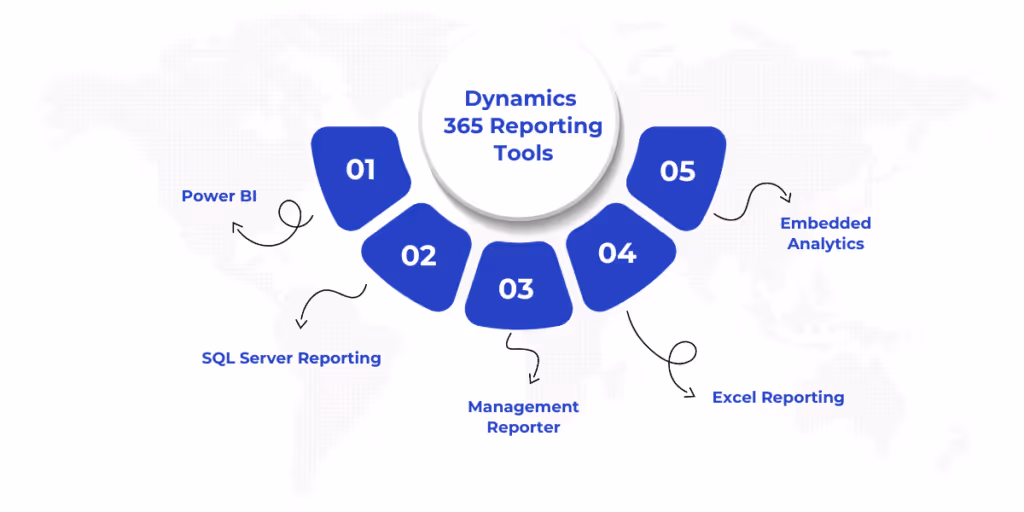
Dynamics 365 offers a variety of reporting tools designed to meet different business needs. Below is a breakdown of the primary reporting options available within the platform, each with its own strengths and use cases.
Power BI is Microsoft’s flagship business intelligence and data visualization tool. It enables users to connect to multiple data sources, transform raw data into meaningful insights, and present those insights through interactive dashboards and reports.
When integrated with Dynamics 365, Power BI becomes a powerful reporting solution that goes beyond standard lists and tables, offering real-time visual analytics right within your Customer Relationship Management (CRM) or Enterprise Resource Planning (ERP) environment.
SQL Server Reporting Services (SSRS) is a server-based reporting platform from Microsoft that enables users to create, deploy, and manage paginated, pixel-perfect reports. Within the Dynamics 365 ecosystem, particularly for Dynamics 365 F&O. SSRS is widely used for creating transactional documents like invoices, purchase orders, and compliance reports.
SSRS is ideal when you need highly formatted, printable reports with precise control over layout and data presentation.
Management Reporter is a financial reporting tool designed specifically for Dynamics 365 Finance (previously known as Dynamics AX or Dynamics 365 Finance and Operations). It allows finance teams to create detailed, professional financial statements without needing to write code or complex queries.
Built to work directly with the general ledger, Management Reporter offers an intuitive interface that enables users to design reports like income statements, balance sheets, and cash flow statements using drag-and-drop rows, columns, and hierarchies.
Excel Reporting refers to the seamless integration between Microsoft Excel and Dynamics 365, allowing users to export, analyze, and interact with live business data directly within Excel. This approach combines the flexibility of Excel with the power of Dynamics 365, enabling users to perform ad-hoc analysis and custom reporting using a tool they already know.
Excel integration is especially valuable for quick insights, pivot table analysis, and modeling without needing IT support or advanced technical skills.
Embedded Analytics refers to the built-in reporting and visualization features that are available directly within the Dynamics 365 user interface. These are pre-configured charts, KPIs, and dashboards that provide real-time, contextual insights without requiring users to switch to external tools like Power BI or Excel.
These analytics are tied to specific workspaces and modules, such as Sales, Finance, or Customer Service, helping users stay informed while they work.
With a clear understanding of each tool’s capabilities, let’s now compare them side by side to help guide your selection process.
Also Read: Financial Reporting in Dynamics 365 Management Reporter
The table below showcases a comprehensive comparison of the best D365 reporting tools:
ToolBest ForCustomizationEase of UseReal-time DataExport OptionsPower BIVisual insights & dashboardsHighMediumYesPDF, Excel, moreSSRSDetailed transactional reportshighMediumDepends on setupPDF, Word, ExcelManagement ReporterFinancial statementsMediumHighYesExcel, PDFExcel Add-inQuick ad hoc reportsMediumHighYesExcelEmbedded AnalyticsDaily operational insightsLowHighYesLimited
Still unsure which tool to choose? The following section will help you make that decision based on your specific needs.

With multiple reporting options available in Dynamics 365, selecting the right tool depends on your audience, needs, and technical environment. Here are four key factors to guide your decision:
The first step is identifying who will use the reports:
Consider how often the reports are needed and how detailed they should be:
Not all reporting tools come with the same licensing model:
Before committing to a tool, ensure it aligns with your current Microsoft licensing and infrastructure.
The best tool is one your team can actually use:
Once you’ve selected a tool, applying reporting best practices can help you get the most out of your setup.
Creating reports is just the beginning, ensuring they remain accurate, accessible, and actionable over time requires smart practices. Here are some essential tips to get the most value from your Dynamics 365 reporting tools:
Not every user needs access to every report. Apply role-based security to ensure sensitive information, like financials or personnel data, is only visible to authorized users. This not only protects your data but also keeps reports relevant to each user’s responsibilities.
Manual report generation is time-consuming and prone to errors. Take advantage of automation features in tools like Power BI and SSRS to schedule data refreshes and report delivery. This ensures stakeholders always see up-to-date information without extra effort.
Charts, graphs, and KPIs often communicate complex data more effectively than tables. Use visuals to highlight trends, outliers, and progress toward goals. Power BI and Embedded Analytics make it easy to create intuitive dashboards that improve decision-making.
Reports are only as good as the data behind them. Regularly review data connections and source integrity, especially when pulling from custom fields, integrations, or legacy systems. This helps maintain trust in your reports and avoids costly misinterpretations.
Also Read: How to Automate Report Generation with AI?
Dynamics 365 offers a powerful suite of reporting tools, each tailored to different business needs and user profiles. No single tool fits every scenario. The most effective reporting strategy often involves a combination, aligned with your team’s skills, data goals, and decision-making processes. Don’t hesitate to experiment with different options and iterate on your setup as your reporting needs evolve.
As your business grows and your data becomes more complex, staying curious, adaptable, and proactive in your reporting approach will ensure you continue to unlock the full value of your Dynamics 365 investment.
Unlock the Full Potential of Your Dynamics 365 Data with WaferWire
At WaferWire, we don’t just implement reporting tools; we help you build a data-driven culture. Whether you need stunning Power BI dashboards, compliant SSRS reports, or financial visibility with Management Reporter, our experts tailor solutions that align with your business goals.
From setup to optimization, we make your reports work smarter.
Contact WaferWire today to transform your Dynamics 365 reporting into strategic insight.
1. Can I use Power BI without leaving Dynamics 365?
Yes, Power BI dashboards and reports can be embedded directly into Dynamics 365, allowing users to view interactive visuals and insights within their familiar interface, no need to switch between applications.
2. Is SSRS still relevant in 2025?
Absolutely. SSRS remains essential for generating pixel-perfect, paginated reports, especially in industries requiring printed documents, compliance reporting, or detailed operational outputs that aren't easily achieved with visualization tools like Power BI.
3. What is the easiest tool for finance teams?
Management Reporter is often the easiest for finance teams, offering a user-friendly, drag-and-drop interface for building financial statements without coding or technical skills, ideal for monthly reports, audits, and general ledger analysis.
4. Are these tools included in my Dynamics 365 license?
Some tools, like Excel integration and Embedded Analytics, are included. Others, like Power BI Pro or advanced SSRS configurations, may require additional licensing depending on your Dynamics 365 plan and deployment setup.
5. Can I create real-time reports with Dynamics 365?
Yes, real-time reporting is possible using tools like Power BI with live connections, Embedded Analytics, and Excel integrations that reflect current Dynamics 365 data without manual refreshes or delays.


Microsoft Dynamics 365 is more than just a suite of business applications. It’s a powerful platform that connects data across finance, operations, sales, and customer engagement. While its core strength lies in managing business processes, its true potential is unlocked through effective reporting.
Dynamics 365 reporting tools enable businesses to track performance, identify trends, and support strategic decisions across departments. From real-time dashboards to detailed financial statements, the right reporting solution helps users turn complex data into clear, actionable insights.
This article provides an overview of the main reporting tools available within Dynamics 365. You will learn how each tool works, when to use it, and how it can support your business goals.
Before diving into individual tools, it’s important to understand why reporting matters in the Dynamics 365 ecosystem and how it supports operational excellence.
Reporting isn’t just a backend function. It’s a strategic asset. Within the Dynamics 365 ecosystem, reporting tools play a critical role in helping businesses gain control over their operations and drive smarter decision-making.
Dynamics 365 connects core business areas like sales, finance, operations, and customer service. Reporting tools bring this data together in one place, giving stakeholders a clear view of performance across the organization.
Whether it's tracking sales Key Performance Indicators (KPIs) or monitoring inventory levels, real-time reports ensure everyone is working from the same source of truth.
Without accurate insights, decisions are based on guesswork. Reporting in Dynamics 365 empowers leaders to move beyond gut instincts by surfacing trends, identifying risks, and forecasting outcomes.
From visual dashboards in Power BI to detailed SSRS reports, users can quickly understand what’s working and what needs attention.
Manually pulling data from multiple systems is time-consuming and error-prone. Dynamics 365 reporting tools automate this process, allowing users to generate up-to-date reports with just a few clicks. This not only saves time but also improves data accuracy and consistency.
For industries with strict regulatory requirements, reporting is essential for maintaining compliance. Dynamics 365 provides structured, auditable reports that help organizations meet standards for financial transparency, tax reporting, and internal controls, reducing risk during audits and inspections.
Now that we’ve covered why reporting is essential, let’s explore the tools Dynamics 365 offers and how each fits different business needs.
Dynamics 365 offers a variety of reporting tools designed to meet different business needs. Below is a breakdown of the primary reporting options available within the platform, each with its own strengths and use cases.
Power BI is Microsoft’s flagship business intelligence and data visualization tool. It enables users to connect to multiple data sources, transform raw data into meaningful insights, and present those insights through interactive dashboards and reports.
When integrated with Dynamics 365, Power BI becomes a powerful reporting solution that goes beyond standard lists and tables, offering real-time visual analytics right within your Customer Relationship Management (CRM) or Enterprise Resource Planning (ERP) environment.
SQL Server Reporting Services (SSRS) is a server-based reporting platform from Microsoft that enables users to create, deploy, and manage paginated, pixel-perfect reports. Within the Dynamics 365 ecosystem, particularly for Dynamics 365 F&O. SSRS is widely used for creating transactional documents like invoices, purchase orders, and compliance reports.
SSRS is ideal when you need highly formatted, printable reports with precise control over layout and data presentation.
Management Reporter is a financial reporting tool designed specifically for Dynamics 365 Finance (previously known as Dynamics AX or Dynamics 365 Finance and Operations). It allows finance teams to create detailed, professional financial statements without needing to write code or complex queries.
Built to work directly with the general ledger, Management Reporter offers an intuitive interface that enables users to design reports like income statements, balance sheets, and cash flow statements using drag-and-drop rows, columns, and hierarchies.
Excel Reporting refers to the seamless integration between Microsoft Excel and Dynamics 365, allowing users to export, analyze, and interact with live business data directly within Excel. This approach combines the flexibility of Excel with the power of Dynamics 365, enabling users to perform ad-hoc analysis and custom reporting using a tool they already know.
Excel integration is especially valuable for quick insights, pivot table analysis, and modeling without needing IT support or advanced technical skills.
Embedded Analytics refers to the built-in reporting and visualization features that are available directly within the Dynamics 365 user interface. These are pre-configured charts, KPIs, and dashboards that provide real-time, contextual insights without requiring users to switch to external tools like Power BI or Excel.
These analytics are tied to specific workspaces and modules, such as Sales, Finance, or Customer Service, helping users stay informed while they work.
With a clear understanding of each tool’s capabilities, let’s now compare them side by side to help guide your selection process.
Also Read: Financial Reporting in Dynamics 365 Management Reporter
The table below showcases a comprehensive comparison of the best D365 reporting tools:
ToolBest ForCustomizationEase of UseReal-time DataExport OptionsPower BIVisual insights & dashboardsHighMediumYesPDF, Excel, moreSSRSDetailed transactional reportshighMediumDepends on setupPDF, Word, ExcelManagement ReporterFinancial statementsMediumHighYesExcel, PDFExcel Add-inQuick ad hoc reportsMediumHighYesExcelEmbedded AnalyticsDaily operational insightsLowHighYesLimited
Still unsure which tool to choose? The following section will help you make that decision based on your specific needs.
With multiple reporting options available in Dynamics 365, selecting the right tool depends on your audience, needs, and technical environment. Here are four key factors to guide your decision:
The first step is identifying who will use the reports:
Consider how often the reports are needed and how detailed they should be:
Not all reporting tools come with the same licensing model:
Before committing to a tool, ensure it aligns with your current Microsoft licensing and infrastructure.
The best tool is one your team can actually use:
Once you’ve selected a tool, applying reporting best practices can help you get the most out of your setup.
Creating reports is just the beginning, ensuring they remain accurate, accessible, and actionable over time requires smart practices. Here are some essential tips to get the most value from your Dynamics 365 reporting tools:
Not every user needs access to every report. Apply role-based security to ensure sensitive information, like financials or personnel data, is only visible to authorized users. This not only protects your data but also keeps reports relevant to each user’s responsibilities.
Manual report generation is time-consuming and prone to errors. Take advantage of automation features in tools like Power BI and SSRS to schedule data refreshes and report delivery. This ensures stakeholders always see up-to-date information without extra effort.
Charts, graphs, and KPIs often communicate complex data more effectively than tables. Use visuals to highlight trends, outliers, and progress toward goals. Power BI and Embedded Analytics make it easy to create intuitive dashboards that improve decision-making.
Reports are only as good as the data behind them. Regularly review data connections and source integrity, especially when pulling from custom fields, integrations, or legacy systems. This helps maintain trust in your reports and avoids costly misinterpretations.
Also Read: How to Automate Report Generation with AI?
Dynamics 365 offers a powerful suite of reporting tools, each tailored to different business needs and user profiles. No single tool fits every scenario. The most effective reporting strategy often involves a combination, aligned with your team’s skills, data goals, and decision-making processes. Don’t hesitate to experiment with different options and iterate on your setup as your reporting needs evolve.
As your business grows and your data becomes more complex, staying curious, adaptable, and proactive in your reporting approach will ensure you continue to unlock the full value of your Dynamics 365 investment.
Unlock the Full Potential of Your Dynamics 365 Data with WaferWire
At WaferWire, we don’t just implement reporting tools; we help you build a data-driven culture. Whether you need stunning Power BI dashboards, compliant SSRS reports, or financial visibility with Management Reporter, our experts tailor solutions that align with your business goals.
From setup to optimization, we make your reports work smarter.
Contact WaferWire today to transform your Dynamics 365 reporting into strategic insight.
1. Can I use Power BI without leaving Dynamics 365?
Yes, Power BI dashboards and reports can be embedded directly into Dynamics 365, allowing users to view interactive visuals and insights within their familiar interface, no need to switch between applications.
2. Is SSRS still relevant in 2025?
Absolutely. SSRS remains essential for generating pixel-perfect, paginated reports, especially in industries requiring printed documents, compliance reporting, or detailed operational outputs that aren't easily achieved with visualization tools like Power BI.
3. What is the easiest tool for finance teams?
Management Reporter is often the easiest for finance teams, offering a user-friendly, drag-and-drop interface for building financial statements without coding or technical skills, ideal for monthly reports, audits, and general ledger analysis.
4. Are these tools included in my Dynamics 365 license?
Some tools, like Excel integration and Embedded Analytics, are included. Others, like Power BI Pro or advanced SSRS configurations, may require additional licensing depending on your Dynamics 365 plan and deployment setup.
5. Can I create real-time reports with Dynamics 365?
Yes, real-time reporting is possible using tools like Power BI with live connections, Embedded Analytics, and Excel integrations that reflect current Dynamics 365 data without manual refreshes or delays.