


Thank you! Your submission has been received!
Oops! Something went wrong while submitting the form.

If you’ve worked with microservices, you know that monitoring can be a real challenge. Keeping track of each service’s performance and health is crucial, but it often feels overwhelming. That’s where the RED and USE methods come in—a simple yet powerful approach that can transform how you monitor your microservices. Focusing on three key metrics, these methods simplify observability and make troubleshooting much more efficient.
This blog will explore how implementing the RED and USE metrics can streamline monitoring and reduce the stress of managing your microservices.
The RED method is a monitoring approach focused on three critical metrics: Rate, Errors, and Duration. These methods are specifically designed to provide clarity and ease when monitoring the performance of services and resources.
The RED method is a monitoring approach focused on three critical metrics: Rate, Errors, and Duration. This method was designed to simplify service monitoring and help teams track the health and performance of their microservices efficiently.
Together, these metrics offer a comprehensive view of your service’s performance, allowing you to pinpoint issues quickly and improve overall service health.
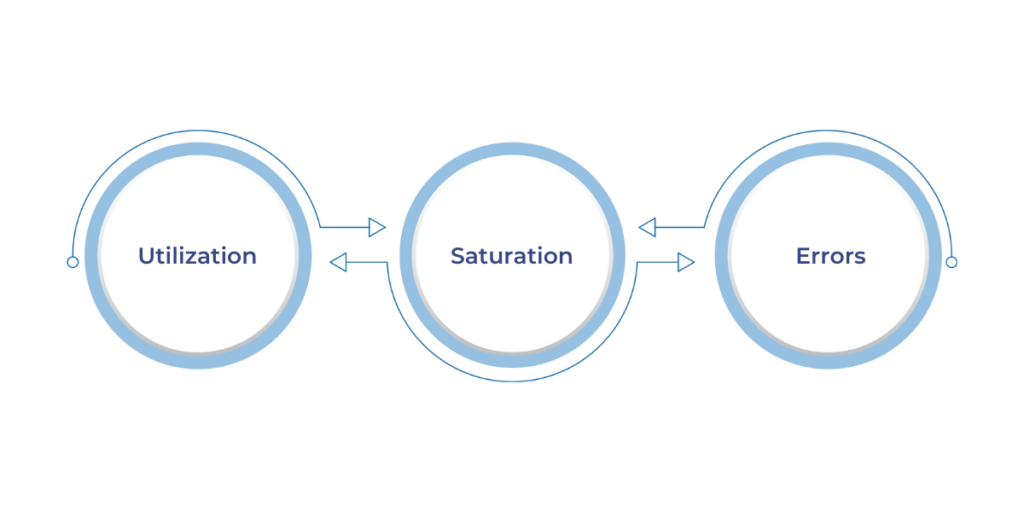
The USE method, developed by Brendan Gregg, is a system resource monitoring approach focusing on utilization, saturation, and errors. This method is specifically designed to provide insights into how system resources like CPU, memory, and disk are being used, helping identify issues that may not be visible through application-level metrics alone.
The USE metrics provide a granular view of system resource behavior, allowing you to address resource-related issues before they cause application failures.
Having discussed USE metrics and their emphasis on system resources, let’s examine how RED and USE metrics collaborate to comprehensively overview your microservices' health and performance.
When monitoring microservices, RED and USE metrics provide a balanced view of service performance and system resource health. These two sets of metrics complement each other by focusing on different layers of the microservices architecture: RED focuses on the external service experience, and USE focuses on internal resource behavior.
RED metrics (Rate, Errors, and Duration) help you track the end-user experience. By monitoring the rate of requests, errors in the system, and the duration of requests, you gain insight into how your service functions from an external perspective.
While RED metrics focus on what users experience, USE metrics (Utilization, Saturation, and Errors) dive into how system resources are used. Monitoring Utilization tells you if resources like CPU or memory are fully utilized, while saturation tracks how close resources are to their limits. If saturation is high, it’s a warning sign that resources might not be able to handle the load, potentially leading to system failures. Errors in this context focus on resource-specific shortcomings, such as disk or network issues.
When used together, RED and USE metrics offer a more complete picture of your system’s health. RED metrics help ensure users have a positive experience, while USE metrics provide the behind-the-scenes view of whether your system can handle the load. For example, a high rate of requests might push your resources to higher Utilization levels, which could lead to Saturation and, ultimately, performance degradation. By combining both metrics, you can proactively address issues before they affect end-users.
Now that you understand the complementary nature of RED and USE metrics, it’s time to implement them in your monitoring strategy.
Implementing RED and USE metrics into your monitoring strategy can significantly enhance your ability to track service performance and system health. By effectively capturing and analyzing these metrics, teams can quickly identify issues and ensure smooth operation.
1. Tools and Techniques for Capturing RED Metrics in Microservices
Tools like Prometheus, Grafana, and Datadog are commonly used to monitor RED metrics (rate, errors, and duration). Prometheus excels at collecting time series data and is widely adopted for tracking service metrics like request rates and error counts. Grafana can visualize these metrics through customizable dashboards, while Datadog offers a comprehensive monitoring solution for both RED and USE metrics, helping you integrate and analyze data across systems.
2. Approaches for Implementing USE Metrics in Modern Systems
For USE metrics, tools such as Prometheus and Nagios effectively monitor system resources like CPU, memory, and network. These tools track Utilization to assess how much of each resource is being used, Saturation to check if resources are approaching full capacity, and errors to detect system failures. By using these tools, you can ensure your infrastructure scales effectively without hitting capacity limits.
3. Best Practices for Integration and Monitoring Strategy
Integrating RED and USE metrics into one cohesive monitoring strategy ensures both service performance and resource health are managed. Combining these metrics into a single dashboard using Grafana helps create a holistic view of system performance. Setting up alerts based on thresholds for both service and resource metrics allows you to identify issues proactively, ensuring a quick response to prevent potential downtime. Regularly review and adjust thresholds to match evolving system demands, particularly as your infrastructure grows.
Now that we’ve discussed implementing RED and USE metrics, let’s examine some real-world applications and their benefits.
Implementing RED and USE metrics is not just about tracking data—it’s about understanding and improving performance. Here's how these metrics work in real-world scenarios and the benefits they bring.
In a high-traffic e-commerce site, RED metrics track the Rate of user requests during peak sales. An unexpected increase can trigger scaling events to handle the load. Simultaneously, USE metrics help monitor CPU utilization and network saturation, ensuring that resources remain available to support the demand. Together, these metrics help scale the application while maintaining system stability.
By continuously tracking RED metrics, the e-commerce platform can detect service failures (e.g., 5xx errors) and take corrective action before users are impacted. Likewise, duration metrics help optimize response times, ensuring users get a fast and seamless experience. USE metrics highlight resource constraints before they affect performance, maintaining the reliability that users expect.
With both RED and USE metrics, teams can address issues before they escalate. For instance, if the rate of requests spikes while CPU utilization is high, it’s a sign of a scaled infrastructure. Monitoring saturation can prevent potential crashes due to overwhelmed resources. By combining both metrics, you can optimize service performance and infrastructure efficiency, making proactive resolutions easier.
Having addressed the practical applications of RED and USE metrics, we shall now examine the challenges and insights gained from implementing these strategies in complex environment systems.
Implementing RED metrics and USE metrics is not without its challenges. While these metrics offer valuable insights into service performance and system health, organizations commonly face several obstacles. Here’s a closer look at those challenges, lessons learned from real-life implementations, and strategies for overcoming them.
A major challenge with RED metrics is managing the high volume of data generated by tracking request rates, error rates, and durations. As systems scale, this data can become overwhelming, especially when monitoring large numbers of microservices. Similarly, USE metrics, which track resource usage like CPU and memory, generate vast amounts of data that must be captured and processed effectively. High cardinality—tracking numerous unique values such as user sessions or paths—can further complicate this process. To address these challenges, it's crucial to appropriately aggregate data and use tools like Prometheus and Grafana to visualize and manage it efficiently. Regular data cleanup and optimization practices also help keep data manageable.
From real-world deployments, we’ve learned that integrating RED metrics and USE metrics early in the development lifecycle is key. By introducing these metrics from the start, teams can proactively monitor performance and resource health as services evolve.
For example, tracking duration (from RED metrics) and correlating it with CPU utilization (from USE metrics) allowed one e-commerce platform to optimize its infrastructure for peak sales periods. Monitoring errors and saturation helped another company prevent system crashes by scaling resources before a failure occurred. Early integration also means problems are identified in development, not after deployment.
Managing high cardinality and ensuring metric consistency are critical for keeping your monitoring systems effective. To handle high cardinality, focus on aggregating data where possible, such as storing average response times rather than individual request durations.
To ensure metric consistency, RED metrics should be measured at regular time intervals. This prevents misalignment in alerts and analysis. Regular audits and fine-tuning of the metrics are also necessary to ensure consistent, reliable data collection as the system scales.
Implementing RED and USE metrics transforms how businesses monitor microservices. These metrics offer a complete view, from service performance to resource health, enabling faster issue detection and optimization. By focusing on rate, errors, and duration (RED) and utilization, saturation, and errors (USE), companies can improve reliability and efficiency.
Adopting these metrics enhances observability and helps teams proactively manage performance. RED and USE metrics provide real-time insights that lead to better resource allocation, faster troubleshooting, and improved user experience.
At WaferWire, we specialize in helping businesses integrate these metrics into their monitoring strategies. We’re here to guide you if you’re looking to optimize your infrastructure and build a more resilient system. Let’s take the next step toward more reliable, scalable operations together. Contact us today.
.png)
