Financial forecasting is essential for strategic decision-making, helping businesses anticipate risks, allocate resources efficiently, and remain agile in a fast-changing market. But for too long, many organizations have relied on fragmented spreadsheets and manual updates, leaving them vulnerable to delays, errors, and missed opportunities.
Microsoft Fabric for financial forecasting offers a powerful solution combining data integration, AI-driven forecasting, and real-time reporting into a cohesive platform. This unified approach transforms financial forecasting from a static task into a dynamic, data-driven process that adapts to changing conditions.
This guide will explore how Microsoft Fabric enables smarter predictions, smoother workflows, and more confident financial planning. Whether you're refining budgets, modeling scenarios, or aligning teams, Fabric provides the clarity and agility modern finance demands.
Financial forecasting is a process that helps businesses predict future economic outcomes. It provides insights into potential profits, expenses, and cash flow, guiding company growth decisions. Instead of relying on guesswork, financial forecasting uses historical data and current trends to form reliable projections.
The importance of financial forecasting cannot be overstated. It helps companies prepare for challenges, allocate resources effectively, and stay agile in a competitive market. For example, if a retail company forecasts a downturn in sales, it can adjust inventory levels and staffing and avoid unnecessary costs. Proper forecasting helps decision-makers avoid financial pitfalls and keep operations running smoothly.
Microsoft Fabric for financial forecasting offers an all-in-one solution. It unifies data integration, AI-driven forecasting, and real-time reporting in one platform. Traditional methods often involve combining data from multiple sources, leading to inefficiencies. Microsoft Fabric streamlines this process, providing a clearer, more accurate picture of financial projections.
With its advanced AI capabilities, Microsoft Fabric can identify trends and provide forecasts based on patterns in historical data. This eliminates much of the guesswork in financial predictions. Moreover, the integration with various data sources ensures that decision-makers have access to real-time information for more timely decisions.
Adopting Microsoft Fabric enhances forecasting accuracy for businesses in industries like retail, manufacturing, and financial services. A retailer, for example, can use Microsoft Fabric to predict seasonal demand shifts and optimize inventory before it’s too late.
Now, let’s move forward and understand the core concepts that drive financial forecasting.
When diving into financial forecasting, it’s essential to first grasp the key concepts that form its foundation. Budget, forecast, and actuals are the cornerstones of this process. These terms are often used interchangeably, but each has its own distinct role in guiding financial decision-making.
Financial forecasting can take several forms, each serving a different purpose. Here are three standard models businesses use to manage financial projections:
Let's now shift our focus to how Microsoft Fabric for financial forecasting can enhance these key concepts and transform your forecasting models.
Microsoft Fabric combines data integration, advanced analytics, and automation into one unified platform. This integration streamlines financial operations, making complex data accessible and actionable. By offering real-time insights, businesses can adjust their forecasts quickly and accurately based on up-to-date data.
Key Features
A standout feature of Microsoft Fabric is its ability to integrate data from multiple sources, such as financial transactions, sales reports, and market trends, into a single platform. This seamless consolidation of data ensures accuracy, which helps businesses build reliable financial models.
Fabric’s powerful analytics engine processes large volumes of data in real time. Financial managers can run complex queries and generate reports instantly, without waiting for lengthy data processing. This feature is essential for staying agile in fast-changing market conditions.
Automation also plays a key role in Microsoft Fabric. Time-consuming tasks like updating reports, reconciling data, or adjusting forecasting models can be automated. This reduces manual workload, enabling teams to focus on more strategic decisions instead of operational tasks.
Microsoft Fabric enhances financial forecasting by enabling data-driven decisions with AI-powered predictive analytics. Through machine learning, Fabric doesn’t just forecast based on historical data. It also adapts predictions to current trends, providing businesses with a clearer path for investment and growth.
The platform guarantees that structured and unstructured financial data are automatically cleaned and prepared for analysis. As a result, there's no longer a need to spend time manually consolidating datasets. The outcome? Ready-to-use, clean data at your disposal, enabling more precise forecasts.
With machine learning and AI, Microsoft Fabric can predict trends, identify risks, and recommend actions, ensuring businesses are better prepared for financial scenarios that may arise. This capability helps companies optimize cost management, revenue generation, and investment strategies.
Having explored the key features of Microsoft Fabric for financial forecasting, let's now focus on how you can use this platform to create a robust financial forecasting model.
Businesses need more than raw data to create an effective financial forecasting model. They need a structured approach that organizes and transforms information into actionable insights. With Microsoft Fabric for economic forecasting, you can build a model that provides clarity and drives decision-making. Here's how to develop your financial forecasting model step-by-step.
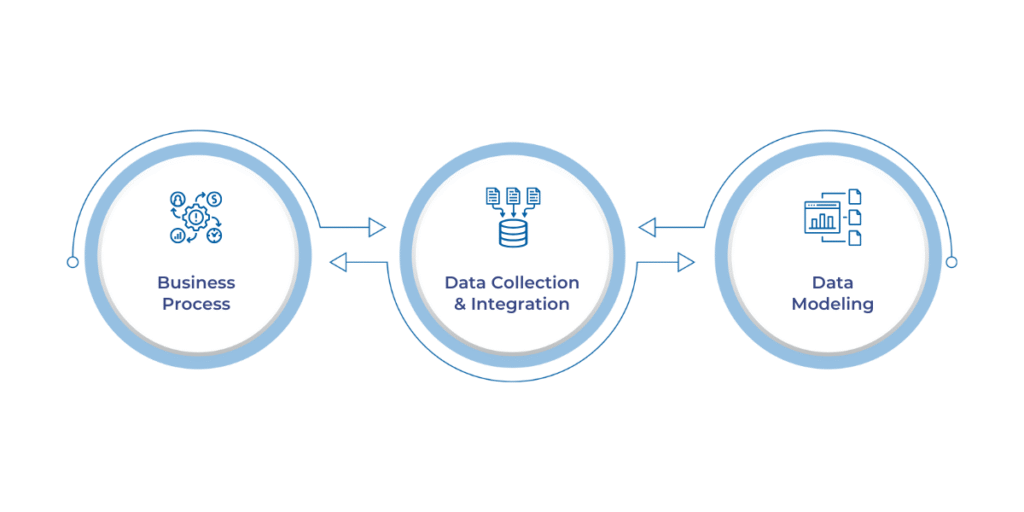
Start by defining the core business processes to be forecasted. Most companies begin with profit and loss (P&L) reporting, which outlines key financial metrics like revenue, costs, and profits. These figures are essential for developing a reliable forecasting model.
At this stage, aligning with industry best practices is critical. Frameworks like those from APQC (American Productivity & Quality Center) can provide a solid foundation for structuring the forecast. This helps ensure that the model is accurate and follows recognized standards in financial reporting.
Once your business process is defined, focus on gathering the historical data to power the forecast. P&L, budgets, and actual financial performance form the core data to shape the estimates.
Microsoft Fabric streamlines this process by integrating data from various sources, whether Excel, Power BI, or other financial systems, into one unified platform. This data integration ensures that all information is consistent, accurate, and up-to-date, which is essential for producing reliable forecasts.
The next step is building your data model. Define the granularity of the data, monthly, quarterly, or annual, depending on the needs of your business. Monthly forecasts may be more relevant for companies with seasonal cycles, while quarterly models work well for longer-term projections.
Create fact tables for budgets, forecasts, and actuals, which will form the backbone of your model. These tables will allow you to compare performance against projections and identify discrepancies. Integrating dimension tables (such as date, account, and department) will enable more detailed analysis and make the data easier to interpret.
Now that your foundational model is set up, let’s explore advanced techniques for forecasting that will help refine and optimize your financial planning.
Tools like Microsoft Fabric for financial forecasting revolutionize how businesses predict financial outcomes. Below are some key advanced techniques that can enhance your financial forecasting model.
Artificial Intelligence (AI) is transforming the world of financial forecasting. Microsoft Fabric for financial forecasting incorporates AI-driven tools that allow businesses to predict future trends more precisely.
AI tools can analyze massive amounts of historical and real-time data, identifying patterns and correlations that might not be visible to the human eye. For example, AI can spot subtle trends in consumer spending or seasonal fluctuations that may affect a retail business's financial forecast. This helps decision-makers plan ahead with a higher degree of confidence.
Machine learning, a subset of AI, further boosts forecasting accuracy. As the system learns from new data, it can automatically adjust and refine its predictions, making forecasts increasingly reliable. This reduces human bias and improves overall financial planning.
Businesses need to be prepared for multiple potential outcomes in the face of uncertainty. Scenario planning is a technique that allows companies to model various future scenarios and understand their potential financial impact. For instance, what if a supplier faces a delay? Or, what if there’s a sudden drop in customer demand? With Microsoft Fabric, businesses can create multiple "what-if" scenarios to explore different possibilities.
Sensitivity analysis helps businesses understand the risk associated with each scenario. It identifies which variables have the most significant effect on financial outcomes. For example, a small change in raw material costs could impact profit margins. Sensitivity analysis allows businesses to gauge the level of risk associated with each factor, ensuring better risk management and more informed decision-making.
With these advanced techniques, Microsoft Fabric for financial forecasting enables more accurate predictions. Now, let’s explore the next critical step: testing and validating your financial forecasting model.
By implementing Test-Driven Development (TDD), you can ensure your forecasts align with reality and that the model produces consistent results. Here's how to apply TDD to your financial models.
Test-driven development (TDD) is a software development approach in which tests are written before the code itself. When applied to financial forecasting, TDD helps define clear expectations and performance benchmarks for the model. Creating test cases for specific financial metrics or forecasts ensures that the model behaves as expected under all scenarios.
In the context of Microsoft Fabric for financial forecasting, you should write test measures that define expected outcomes for key metrics. These test measures could include:
Once these measures are defined, you can automate tests to run at different stages of data integration.
Real data validation is essential to ensure the integrity of your forecasts. Microsoft Fabric for financial forecasting provides real-time data processing, ensuring that your financial model updates dynamically as new data enters the system. By comparing model predictions with actual financial data, you can identify potential errors or inaccuracies in the forecasts.
For example, if your model predicts sales growth based on a previous quarter's performance but actual sales do not meet expectations, the model can adjust and provide updated forecasts. This data-driven feedback loop ensures that forecasting models remain accurate and relevant.
With testing and validation in place, it’s time to integrate DataOps and DevOps practices to further streamline your forecasting model and enhance collaboration.
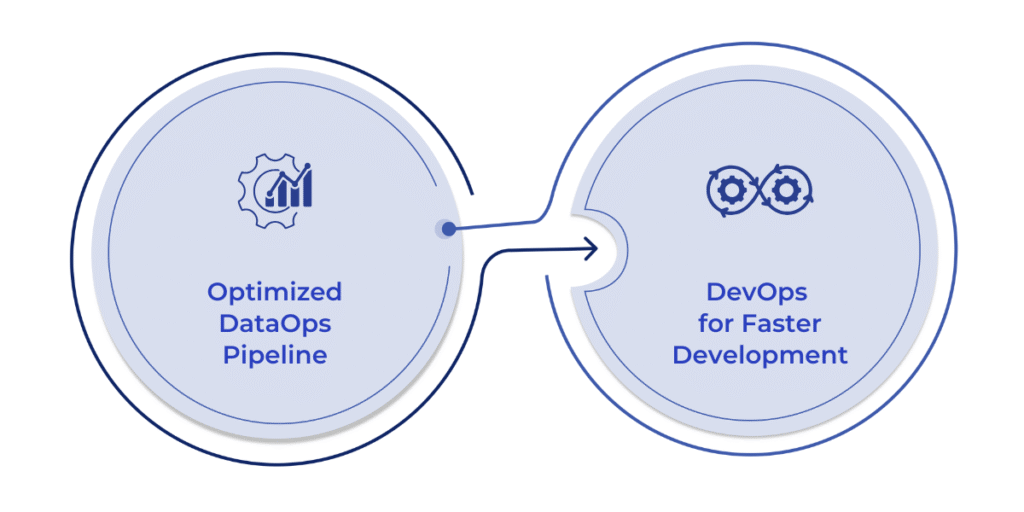
Microsoft Fabric for financial forecasting streamlines data management and model deployment by integrating DataOps and DevOps practices. These integrations ensure smooth data flow, efficient model building, and quick deployment, which is critical for delivering accurate financial forecasts.
DataOps optimizes the movement of data from its initial entry to actionable insights. It focuses on automating and improving the data pipeline to speed up the information processing used for forecasting. With Microsoft Fabric for financial forecasting, DataOps ensures seamless data integration across various systems without delays or errors.
Data quality is key to producing reliable forecasts. DataOps automates the process of cleansing and transforming data, ensuring consistency and accuracy. This automation reduces human error, making the forecasting model more reliable.
By automating data pipelines, Microsoft Fabric allows businesses to ingest and process new financial data continuously. This streamlined data flow ensures that forecasts are always up-to-date and reflect the latest available information.
DevOps is all about efficiency in the development and deployment of software. When applied to financial forecasting, it ensures smooth creation, testing, and deployment of forecasting models.
By incorporating DevOps practices, businesses can use version control to manage the forecasting model’s updates and changes. Automated testing and continuous integration help identify potential issues early on, ensuring the model runs smoothly and remains accurate.
Microsoft Fabric for financial forecasting integrates seamlessly with tools like Azure DevOps and GitHub, automating workflows and deployment processes. This integration enables businesses to transition quickly from development to production, ensuring financial forecasts reflect the most up-to-date data.
Once you've integrated DataOps and DevOps, the next step is to focus on continuous improvement to ensure your forecasting model stays accurate and delivers reliable results.
Financial forecasting models require ongoing adjustments to stay accurate and effective. Microsoft Fabric for financial forecasting provides the tools and framework necessary to refine and improve models continuously.
Financial forecasts' accuracy depends heavily on the user, stakeholder, and real-time data feedback. Businesses can refine their forecasting models by actively collecting feedback from decision-makers and financial analysts. Stakeholders' insights can help identify areas for improvement and suggest adjustments to make the model more precise.
Integrating Continuous Deployment (CI/CD) practices ensures that financial forecasting models are always up-to-date. Microsoft Fabric for financial forecasting supports this integration by automating the deployment of updates to forecasting models. This ensures that any improvements or adjustments to the model are rolled out smoothly and efficiently without delays.
Tools like Azure DevOps and GitHub help automate this process, making it easier to deploy and test new versions of financial models in real time. This reduces the risk of errors and keeps the forecast accurate and aligned with current data.
With continuous deployment, updates to the forecasting model are done seamlessly, ensuring there’s no disruption in operations. Businesses can immediately respond to changes in the data, maintaining accurate financial projections at all times.
The key advantages of Microsoft Fabric are clear: automated data pipelines, accurate financial models, and continuous refinement. With its advanced AI tools and smooth integration with DevOps and DataOps, Microsoft Fabric ensures forecasts are always updated and aligned with current data. This reduces the risk of errors and enhances forecasting accuracy, making it an essential tool for today’s financial teams.
AI and automation undoubtedly shape the future of financial forecasting. As Microsoft Fabric evolves, it will continue integrating cutting-edge technologies, offering even more predictive capabilities. Financial models will become smarter, with enhanced machine learning algorithms, better risk assessment tools, and faster decision-making support.
To stay ahead in this rapidly changing environment, start using Microsoft Fabric for financial forecasting today. WaferWire, a trusted partner in your digital transformation journey, helps you implement and optimize Microsoft Fabric’s capabilities. Whether you’re looking to streamline your financial operations or integrate advanced forecasting models, WaferWire’s expert consulting and implementation support ensure you get the most out of these tools.
Schedule a demo to experience the future of financial forecasting firsthand.
.png)