.png)


Thank you! Your submission has been received!
Oops! Something went wrong while submitting the form.


We belong to a time of increasingly speed-driven marketplace. To pull ahead, keeping up with data is possibly the only way. The numbers imply that companies that leverage data effectively are 23 times more likely to acquire customers and six times more likely to retain them.
Integrating Power BI with Dynamics 365 Finance and Dynamics 365 Operations empowers organizations to transform vast amounts of ERP data into actionable insights, enabling faster, smarter decisions across finance, supply chain, and operations.
By setting up this integration, you gain near real-time visibility into your financial health, operational efficiency, and procurement effectiveness, all within an intuitive, interactive dashboard.
This guide will walk you through each essential step to connect Power BI with Dynamics 365 Finance and Operations, ensuring you get the most out of your data and drive measurable business impact.
Bringing together Power BI and Dynamics 365 Finance and Dynamics 365 Operations lets you extract detailed, timely insights from your ERP data. This connection lays the groundwork for building tailored analytics that align with your business processes and reporting needs.
Before embarking on this integration, it's crucial to ensure that your environment is properly configured. Here's a comprehensive checklist to guide you:
A Power BI Pro license is essential for creating, sharing, and collaborating on reports within the Power BI service. While viewing reports within either of the Dynamics 365 doesn't necessitate a Pro license, publishing and sharing these reports requires one. This license facilitates:
Administrator privileges in Dynamic 365 Finance and Operation are vital for configuring system-wide settings, including Power BI integration. Ensure you have access to:
Since Dynamic 365 Finance and Operation and Power BI are both Microsoft services, they rely on Azure AD for authentication and authorization. Steps to configure Azure AD include:
Power BI Desktop is the primary tool for designing and developing reports. Proficiency in Power BI Desktop includes:
Data entities in both Dynamics 365 Finance and Dynamics 365 Operations represent logical groupings of data that can be exported and consumed by external applications like Power BI. Key considerations include:
With these prerequisites met, you’ll be well-prepared to move forward with the integration steps.
Also Read: Microsoft Dynamics 365- Your steering to drive customer engagement success
Next, let’s explore how to enable Power BI integration directly within your Dynamics 365 Finance and Operations environment.
Before diving into building reports, the crucial first step is to properly configure the connection between Power BI and your Dynamics 365 Finance and Operations environment.
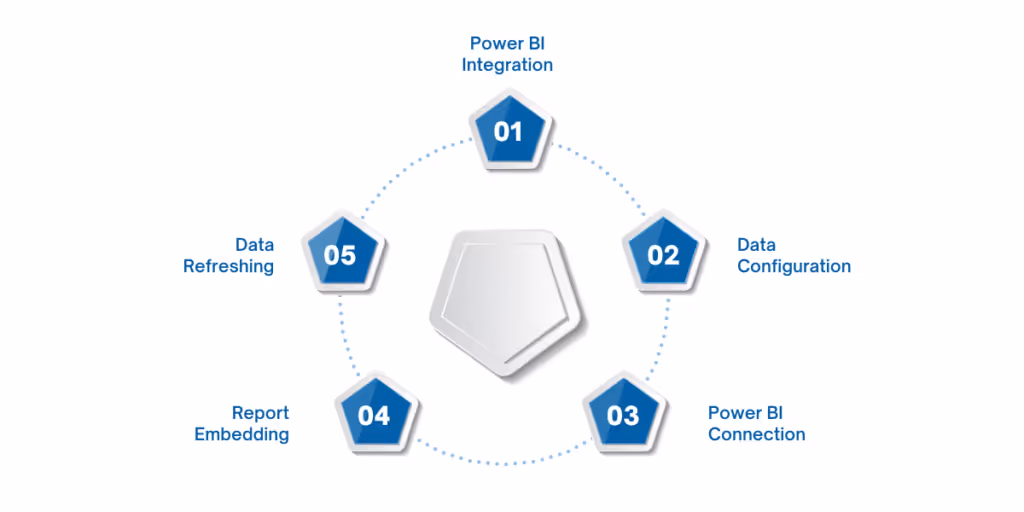
This involves enabling Power BI integration within Dynamic 365 Finance and Operation, preparing the data sources, connecting Power BI Desktop, embedding reports, and ensuring your data stays current with scheduled refreshes. Each step plays a vital role in creating a robust, reliable analytics platform tailored to your business needs:
To begin, you need to activate Power BI integration within your Dynamics 365 Finance and Dynamics 365 Operations environment. This allows Power BI reports to be embedded directly in your ERP interface, providing users with real-time insights without switching applications.
How to Enable:
Enabling this feature not only allows embedding of interactive Power BI reports on your ERP forms and dashboards but also ensures that security and access controls are aligned between both platforms. This step establishes the groundwork for seamless data consumption and user experience.
Power BI requires access to your business data in a structured, queryable format. Dynamics 365 Finance and Dynamics 365 Operations provide this through data entities and OData feeds.
Setting Up Data Export:
Enabling OData Feeds:
OData feeds offer a real-time, RESTful data source for Power BI to pull data dynamically, eliminating the need for manual data transfers and enabling up-to-date analytics. Configuring export projects and OData correctly ensures data integrity and responsiveness.
With your data exposed via OData, the next step is to connect Power BI Desktop and start building your reports.
How to Connect:
Once data is loaded, you can create tailored visuals, build relationships between entities, and design interactive reports. Power BI’s rich visualization capabilities allow you to highlight trends, exceptions, and key performance indicators from your ERP data.
Once your connection is live, the next step is to embed reports seamlessly within your Dynamics 365 workspace.
To enhance user experience, Power BI reports can be embedded within Dynamic 365 Finance and Operation screens, making insights available contextually alongside transactional data.
Embedding Process:
Embedding reports reduces switching between applications, fostering faster, data-driven decision-making right where operational activities occur.
To ensure your reports always reflect current business data, set up scheduled refreshes in Power BI Service.
Steps to Schedule Refresh:
Automating data refresh removes manual overhead, guarantees report accuracy, and ensures decision-makers have access to timely information.
With reports embedded and refreshed, it’s time to elevate your analytics further through advanced customizations.
Once you have your basic Power BI reports connected and running with Dynamics 365 Finance and Operations data, advanced customizations can elevate your analytics from standard dashboards to strategic decision-making tools. These enhancements unlock deeper insights, improve usability, and tailor reports to your organization’s specific needs.
Here’s a walkthrough of key advanced customization techniques:
Strong data models enable efficient, accurate analysis by structuring your data correctly and defining how tables relate to each other.
Key Actions:
Data Analysis Expressions (DAX) lets you build dynamic calculations that update based on filters and slicers, providing powerful and flexible metrics.
Key Actions:
A report’s usability can greatly impact how insights are understood and applied.
Key Actions:
Ensuring data privacy and governance by restricting data access based on user roles is essential for compliance and trust.
Key Actions:
Fast-loading reports improve adoption and user satisfaction.
Key Actions:
Combining Power BI with complementary platforms can provide richer context and broader reach.
Key Actions:
After setting up your reports, focusing on the right insights becomes crucial. Let’s look at key Power BI reports that drive value for Finance and Operations teams.
To fully harness the value of integrating Power BI with Dynamics 365 Finance and Operations, it's important to focus on reports that deliver actionable insights across your core business functions.
The following three report categories—Financial Performance, Inventory Management, and Procurement & Vendor Analysis—offer deep visibility into critical areas, helping teams make data-driven decisions. Each report type can be customized with advanced analytics and interactive features tailored to your organization’s unique workflows.
A well-designed financial dashboard consolidates vital accounting and budgeting metrics into a single interface, offering finance leaders a real-time pulse on organizational health. By visualizing revenue streams, expense breakdowns, and profitability trends, this dashboard supports strategic planning and operational control.
Core Components:
This dashboard enables CFOs and controllers to pinpoint financial bottlenecks, improve cash flow forecasting accuracy, and optimize working capital management, ultimately supporting more confident financial stewardship and compliance.
Also read: Financial Reporting in Dynamics 365 Management Reporter
Managing inventory efficiently is crucial for balancing customer demand with cost control. This report offers supply chain and warehouse managers actionable insights into stock health, turnover dynamics, and supplier reliability, helping to streamline inventory processes.
Core Components:
By highlighting inventory risks and opportunities, this report supports minimizing holding costs, improving order fulfillment rates, and enhancing overall supply chain agility.
Understanding purchasing patterns and vendor performance is essential for optimising procurement efficiency and cost savings. This report delivers comprehensive visibility into spend categories, supplier reliability, and compliance, empowering procurement teams to drive better outcomes.
Core Components:
This report equips procurement teams to strengthen supplier relationships, negotiate favorable contracts, and ensure supply continuity, contributing to cost reduction and risk mitigation.
By following a structured setup process, activating integration, configuring data feeds, embedding reports, and applying advanced customizations, you can unlock similar benefits for your organization. Beyond just numbers, this integration fosters a culture of data-driven decision-making that accelerates growth, enhances agility, and improves stakeholder confidence.
When it comes to deploying Dynamics 365 Customer Engagement and Finance & Operations, going through a trusted Microsoft Gold Partner like WaferWire makes all the difference.
Partner with WaferWire to unlock the full potential of Dynamics 365, powered by innovation, best practices, and dedicated service that puts your business goals first.


We belong to a time of increasingly speed-driven marketplace. To pull ahead, keeping up with data is possibly the only way. The numbers imply that companies that leverage data effectively are 23 times more likely to acquire customers and six times more likely to retain them.
Integrating Power BI with Dynamics 365 Finance and Dynamics 365 Operations empowers organizations to transform vast amounts of ERP data into actionable insights, enabling faster, smarter decisions across finance, supply chain, and operations.
By setting up this integration, you gain near real-time visibility into your financial health, operational efficiency, and procurement effectiveness, all within an intuitive, interactive dashboard.
This guide will walk you through each essential step to connect Power BI with Dynamics 365 Finance and Operations, ensuring you get the most out of your data and drive measurable business impact.
Bringing together Power BI and Dynamics 365 Finance and Dynamics 365 Operations lets you extract detailed, timely insights from your ERP data. This connection lays the groundwork for building tailored analytics that align with your business processes and reporting needs.
Before embarking on this integration, it's crucial to ensure that your environment is properly configured. Here's a comprehensive checklist to guide you:
A Power BI Pro license is essential for creating, sharing, and collaborating on reports within the Power BI service. While viewing reports within either of the Dynamics 365 doesn't necessitate a Pro license, publishing and sharing these reports requires one. This license facilitates:
Administrator privileges in Dynamic 365 Finance and Operation are vital for configuring system-wide settings, including Power BI integration. Ensure you have access to:
Since Dynamic 365 Finance and Operation and Power BI are both Microsoft services, they rely on Azure AD for authentication and authorization. Steps to configure Azure AD include:
Power BI Desktop is the primary tool for designing and developing reports. Proficiency in Power BI Desktop includes:
Data entities in both Dynamics 365 Finance and Dynamics 365 Operations represent logical groupings of data that can be exported and consumed by external applications like Power BI. Key considerations include:
With these prerequisites met, you’ll be well-prepared to move forward with the integration steps.
Also Read: Microsoft Dynamics 365- Your steering to drive customer engagement success
Next, let’s explore how to enable Power BI integration directly within your Dynamics 365 Finance and Operations environment.
Before diving into building reports, the crucial first step is to properly configure the connection between Power BI and your Dynamics 365 Finance and Operations environment.
This involves enabling Power BI integration within Dynamic 365 Finance and Operation, preparing the data sources, connecting Power BI Desktop, embedding reports, and ensuring your data stays current with scheduled refreshes. Each step plays a vital role in creating a robust, reliable analytics platform tailored to your business needs:
To begin, you need to activate Power BI integration within your Dynamics 365 Finance and Dynamics 365 Operations environment. This allows Power BI reports to be embedded directly in your ERP interface, providing users with real-time insights without switching applications.
How to Enable:
Enabling this feature not only allows embedding of interactive Power BI reports on your ERP forms and dashboards but also ensures that security and access controls are aligned between both platforms. This step establishes the groundwork for seamless data consumption and user experience.
Power BI requires access to your business data in a structured, queryable format. Dynamics 365 Finance and Dynamics 365 Operations provide this through data entities and OData feeds.
Setting Up Data Export:
Enabling OData Feeds:
OData feeds offer a real-time, RESTful data source for Power BI to pull data dynamically, eliminating the need for manual data transfers and enabling up-to-date analytics. Configuring export projects and OData correctly ensures data integrity and responsiveness.
With your data exposed via OData, the next step is to connect Power BI Desktop and start building your reports.
How to Connect:
Once data is loaded, you can create tailored visuals, build relationships between entities, and design interactive reports. Power BI’s rich visualization capabilities allow you to highlight trends, exceptions, and key performance indicators from your ERP data.
Once your connection is live, the next step is to embed reports seamlessly within your Dynamics 365 workspace.
To enhance user experience, Power BI reports can be embedded within Dynamic 365 Finance and Operation screens, making insights available contextually alongside transactional data.
Embedding Process:
Embedding reports reduces switching between applications, fostering faster, data-driven decision-making right where operational activities occur.
To ensure your reports always reflect current business data, set up scheduled refreshes in Power BI Service.
Steps to Schedule Refresh:
Automating data refresh removes manual overhead, guarantees report accuracy, and ensures decision-makers have access to timely information.
With reports embedded and refreshed, it’s time to elevate your analytics further through advanced customizations.
Once you have your basic Power BI reports connected and running with Dynamics 365 Finance and Operations data, advanced customizations can elevate your analytics from standard dashboards to strategic decision-making tools. These enhancements unlock deeper insights, improve usability, and tailor reports to your organization’s specific needs.
Here’s a walkthrough of key advanced customization techniques:
Strong data models enable efficient, accurate analysis by structuring your data correctly and defining how tables relate to each other.
Key Actions:
Data Analysis Expressions (DAX) lets you build dynamic calculations that update based on filters and slicers, providing powerful and flexible metrics.
Key Actions:
A report’s usability can greatly impact how insights are understood and applied.
Key Actions:
Ensuring data privacy and governance by restricting data access based on user roles is essential for compliance and trust.
Key Actions:
Fast-loading reports improve adoption and user satisfaction.
Key Actions:
Combining Power BI with complementary platforms can provide richer context and broader reach.
Key Actions:
After setting up your reports, focusing on the right insights becomes crucial. Let’s look at key Power BI reports that drive value for Finance and Operations teams.
To fully harness the value of integrating Power BI with Dynamics 365 Finance and Operations, it's important to focus on reports that deliver actionable insights across your core business functions.
The following three report categories—Financial Performance, Inventory Management, and Procurement & Vendor Analysis—offer deep visibility into critical areas, helping teams make data-driven decisions. Each report type can be customized with advanced analytics and interactive features tailored to your organization’s unique workflows.
A well-designed financial dashboard consolidates vital accounting and budgeting metrics into a single interface, offering finance leaders a real-time pulse on organizational health. By visualizing revenue streams, expense breakdowns, and profitability trends, this dashboard supports strategic planning and operational control.
Core Components:
This dashboard enables CFOs and controllers to pinpoint financial bottlenecks, improve cash flow forecasting accuracy, and optimize working capital management, ultimately supporting more confident financial stewardship and compliance.
Also read: Financial Reporting in Dynamics 365 Management Reporter
Managing inventory efficiently is crucial for balancing customer demand with cost control. This report offers supply chain and warehouse managers actionable insights into stock health, turnover dynamics, and supplier reliability, helping to streamline inventory processes.
Core Components:
By highlighting inventory risks and opportunities, this report supports minimizing holding costs, improving order fulfillment rates, and enhancing overall supply chain agility.
Understanding purchasing patterns and vendor performance is essential for optimising procurement efficiency and cost savings. This report delivers comprehensive visibility into spend categories, supplier reliability, and compliance, empowering procurement teams to drive better outcomes.
Core Components:
This report equips procurement teams to strengthen supplier relationships, negotiate favorable contracts, and ensure supply continuity, contributing to cost reduction and risk mitigation.
By following a structured setup process, activating integration, configuring data feeds, embedding reports, and applying advanced customizations, you can unlock similar benefits for your organization. Beyond just numbers, this integration fosters a culture of data-driven decision-making that accelerates growth, enhances agility, and improves stakeholder confidence.
When it comes to deploying Dynamics 365 Customer Engagement and Finance & Operations, going through a trusted Microsoft Gold Partner like WaferWire makes all the difference.
Partner with WaferWire to unlock the full potential of Dynamics 365, powered by innovation, best practices, and dedicated service that puts your business goals first.